HAProxy is a popular software based load balancer used by many big tech companies as a layer 4 or layer 7 load balancer. HAProxy has a default /stats endpoint that provides a rudimentary view of the load balancer frontends and backends, and their statuses via a web based dashboard. While this stats page provides an easy view into some of the load balancer functionality, it lacks the advanced signals or metrics needed to run a high stakes production load balancer. Engineers need insight into statistics like the number of concurrent connections, bytes in and out, etc.
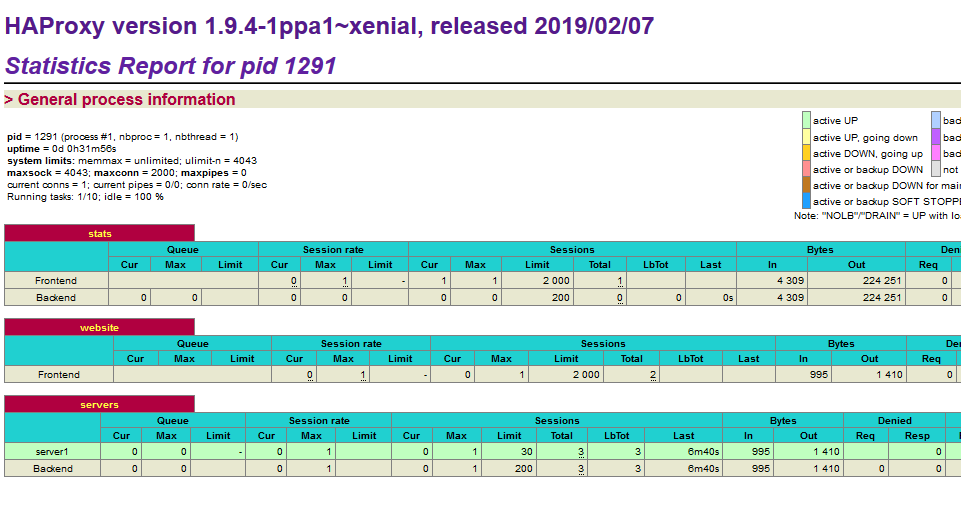 Basic HAProxy stats page
“Prometheus is an open-source systems monitoring and alerting toolkit. Prometheus collects and stores its metrics as time series data, i.e. metrics information is stored with the timestamp at which it was recorded” - From prometheus.io
“Grafana is a multi-platform open source analytics and interactive visualization web application. It can produce charts, graphs, and alerts for the web when connected to supported data sources.“ - Wikipedia definition
In this article, we will be exporting metrics emitted by HAProxy to Prometheus so that we can visualize the signals and make meaningful inferences out of it.
We need to configure three things for this to work. First, the HAProxy configuration needs to expose a Prometheus frontend in a particular port number. Second, the Prometheus server needs to specify the HAProxy’s IP address and exposed metrics port number so that it can scrape it periodically. Third, Grafana needs to point to the Prometheus IP address and port to know where to fetch the metrics data from. In short:
- Setup an HAProxy load balancer as a layer 7 http proxy, along with a couple of backend web servers.
- Setup a Prometheus server that will periodically scrape the HAProxy /stats endpoint for metrics.
- Setup a Grafana server that will visualize the data from Prometheus.
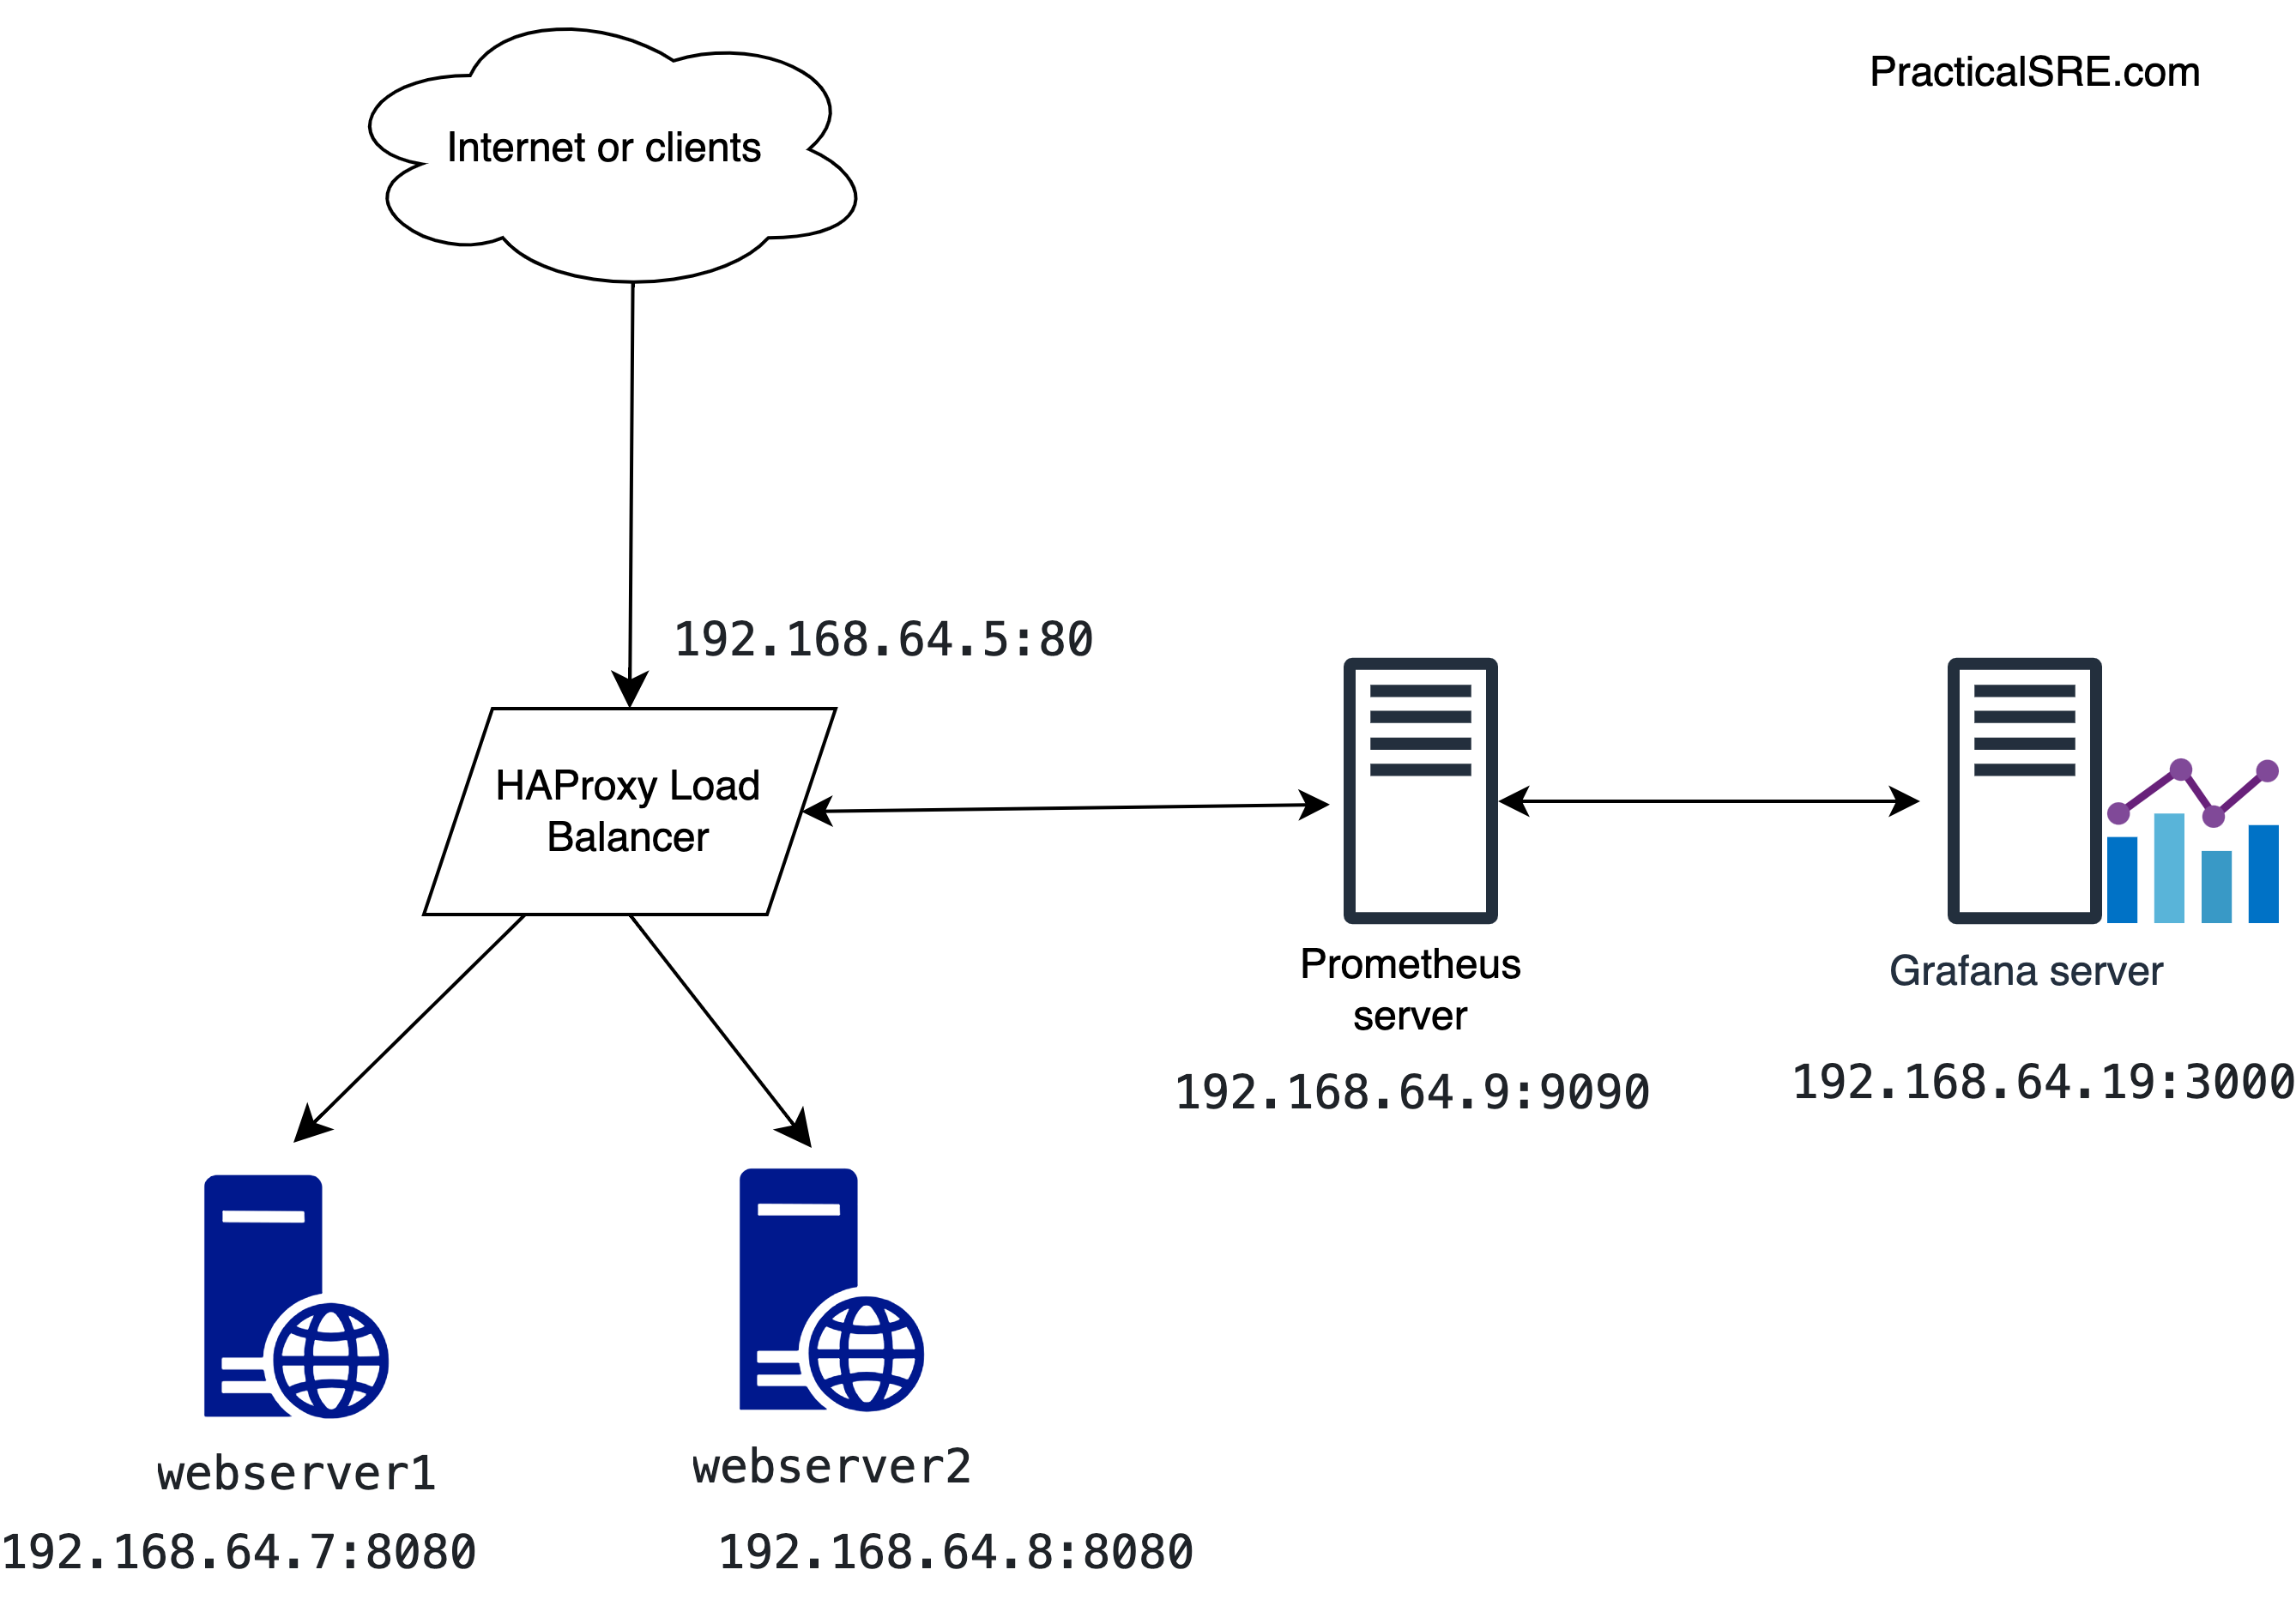
HAProxy and web server setup
This article assumes there is an existing HAProxy and web server lab setup. For a more detailed view into setting up HAProxy and the web app, refer to this previous article.
Configure the /etc/haproxy/haproxy.cfg file with the following configs.
defaults
  mode http

frontend prometheus
  bind :8405
  mode http
  http-request use-service prometheus-exporter
  no log


frontend www
    # receives traffic from clients
    bind :80
    default_backend web_servers
backend web_servers
    # relays the client messages to backend web servers round-robin by default
    server webserver1 192.168.64.8:8080 check
    server webserver2 192.168.64.7:8080 check
Here’s what each of those config options are for:
mode: http means this is using the layer 7 http mode of load balancer.
Since HAProxy comes with this inbuilt Prometheus feature, it is as simple as adding the following frontends to the config.
frontend prometheus:
This creates a new frontend that exposes port 8405. It uses a HAProxy in built service called Prometheus-exporter.
frontend www and backend web_servers:
These are frontend for the http request on port 80 and the webapps that will respond respectively.
Prometheus server setup
Create a new ubuntu server called prometheus1. In this new server, we will install a Prometheus instance using docker, so Docker should already be installed on this host.
Create the following config file called prometheus.yml
global:
  scrape_interval: 15s # Set the scrape interval to every 15 seconds. Default is every 1 minute.
  evaluation_interval: 15s # Evaluate rules every 15 seconds. The default is every 1 minute.

scrape_configs:
  - job_name: 'haproxy-load-balancer-metrics'
	static_configs:
  	- targets: ['192.168.64.5:8405']
192.168.64.5 here is the HAProxy IP address.
The target is the HAProxy server IP address and the port number where the Prometheus metrics are exposed.
Execute the following docker command to run the Prometheus server. The above config file is in /home/ubuntu/prometheus.yml
docker run \
    -p 9090:9090 \
    -v /home/ubuntu/prometheus.yml:/etc/prometheus/prometheus.yml \
    prom/Prometheus
Prometheus is now running on the prometheus ubuntu machine, and can be accessed on a web browser by typing in the server IP and the Prometheus port (9090).
Navigate to the targets page to see the metrics from HAProxy.
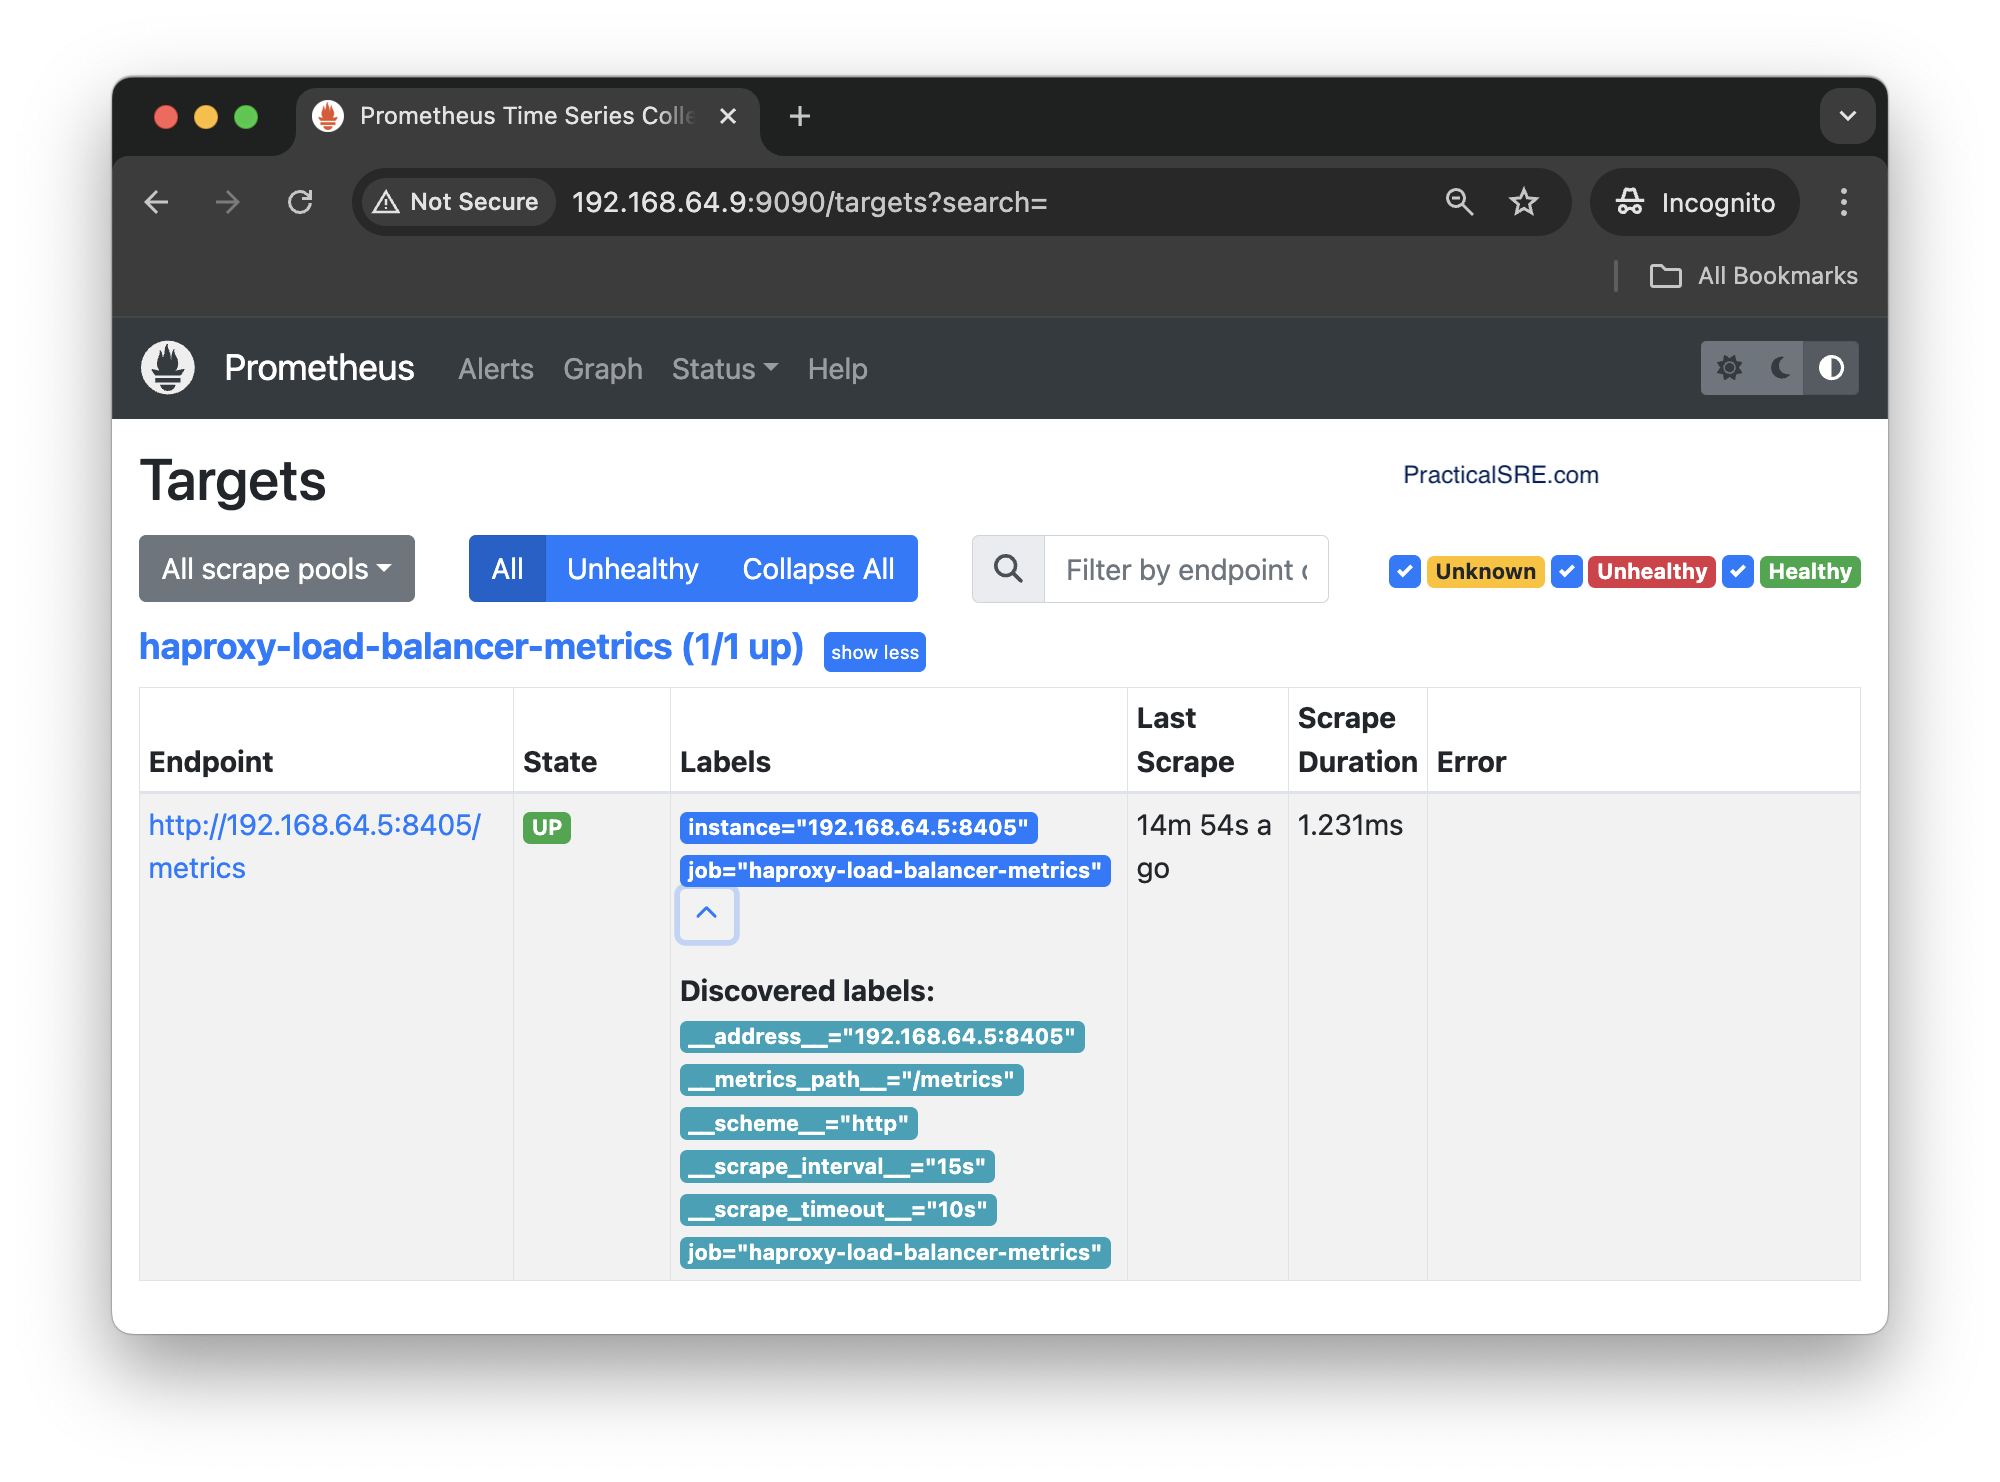
Typing in the name of the metrics will show a drop down of all available HAProxy metrics.
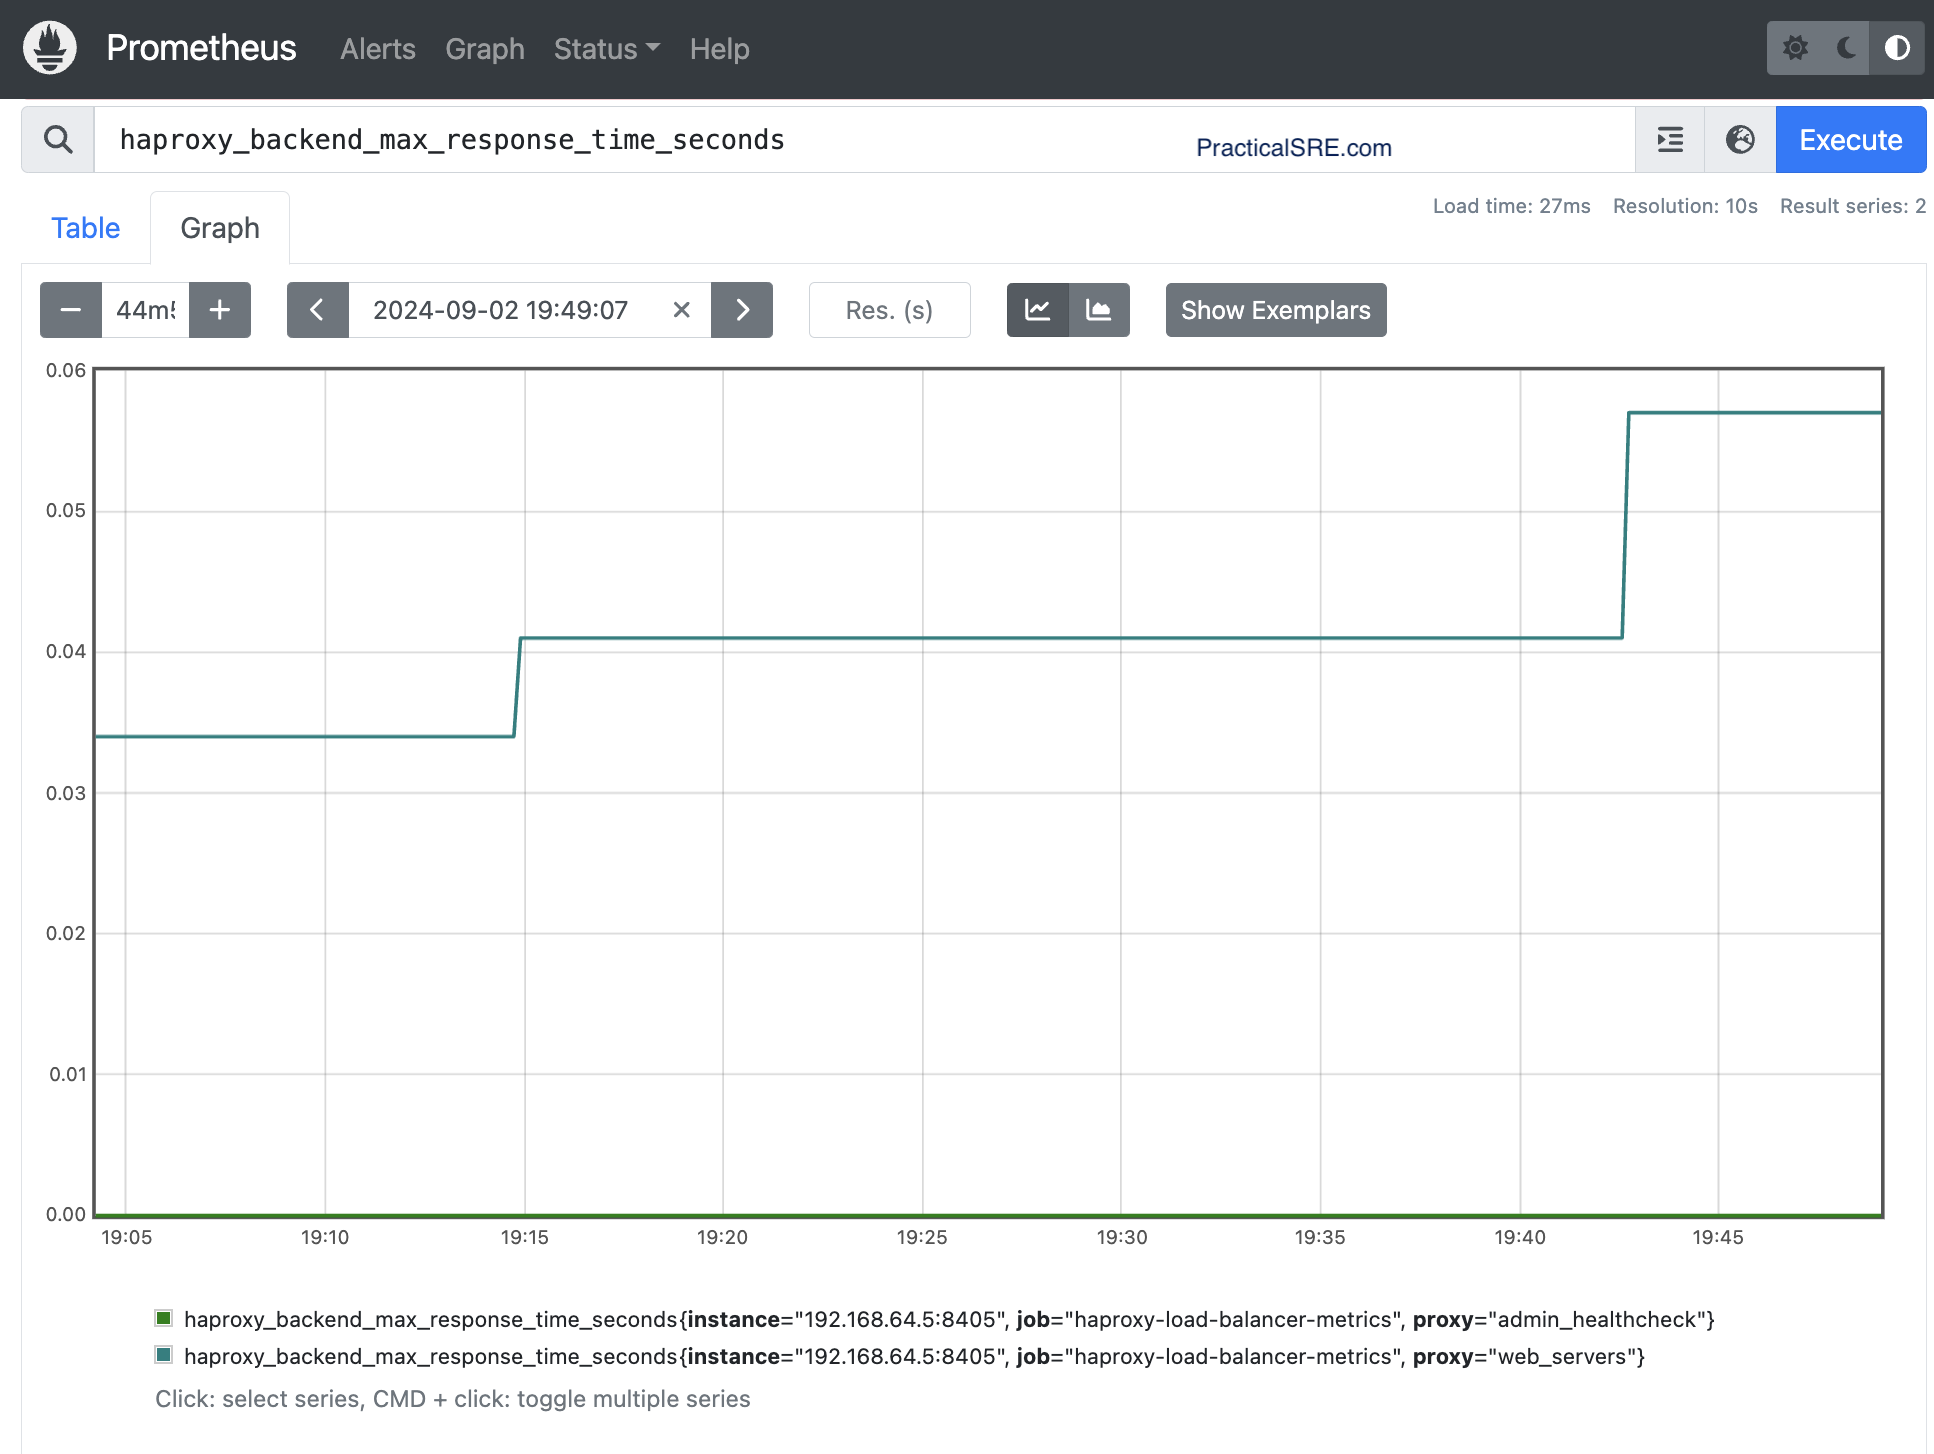
Prometheus scrapes the HAProxy metrics endpoint every 15 seconds and stores this data locally. Prometheus provides a rudimentary graph which can plot the time series data, but we will be using Grafana to plot the graphs.
Grafana Server and Dashboard setup
Now that the metrics are available in Prometheus, we will setup a new Ubuntu machine to host the Grafana server.
$multipass launch lts –name grafana

$multipass shell grafana

$sudo snap install docker

$docker run -d -p 3000:3000 --name=grafana grafana/grafana-enterprise
Navigate to the Grafana server IP and port 3000. You should see a Grafana UI.
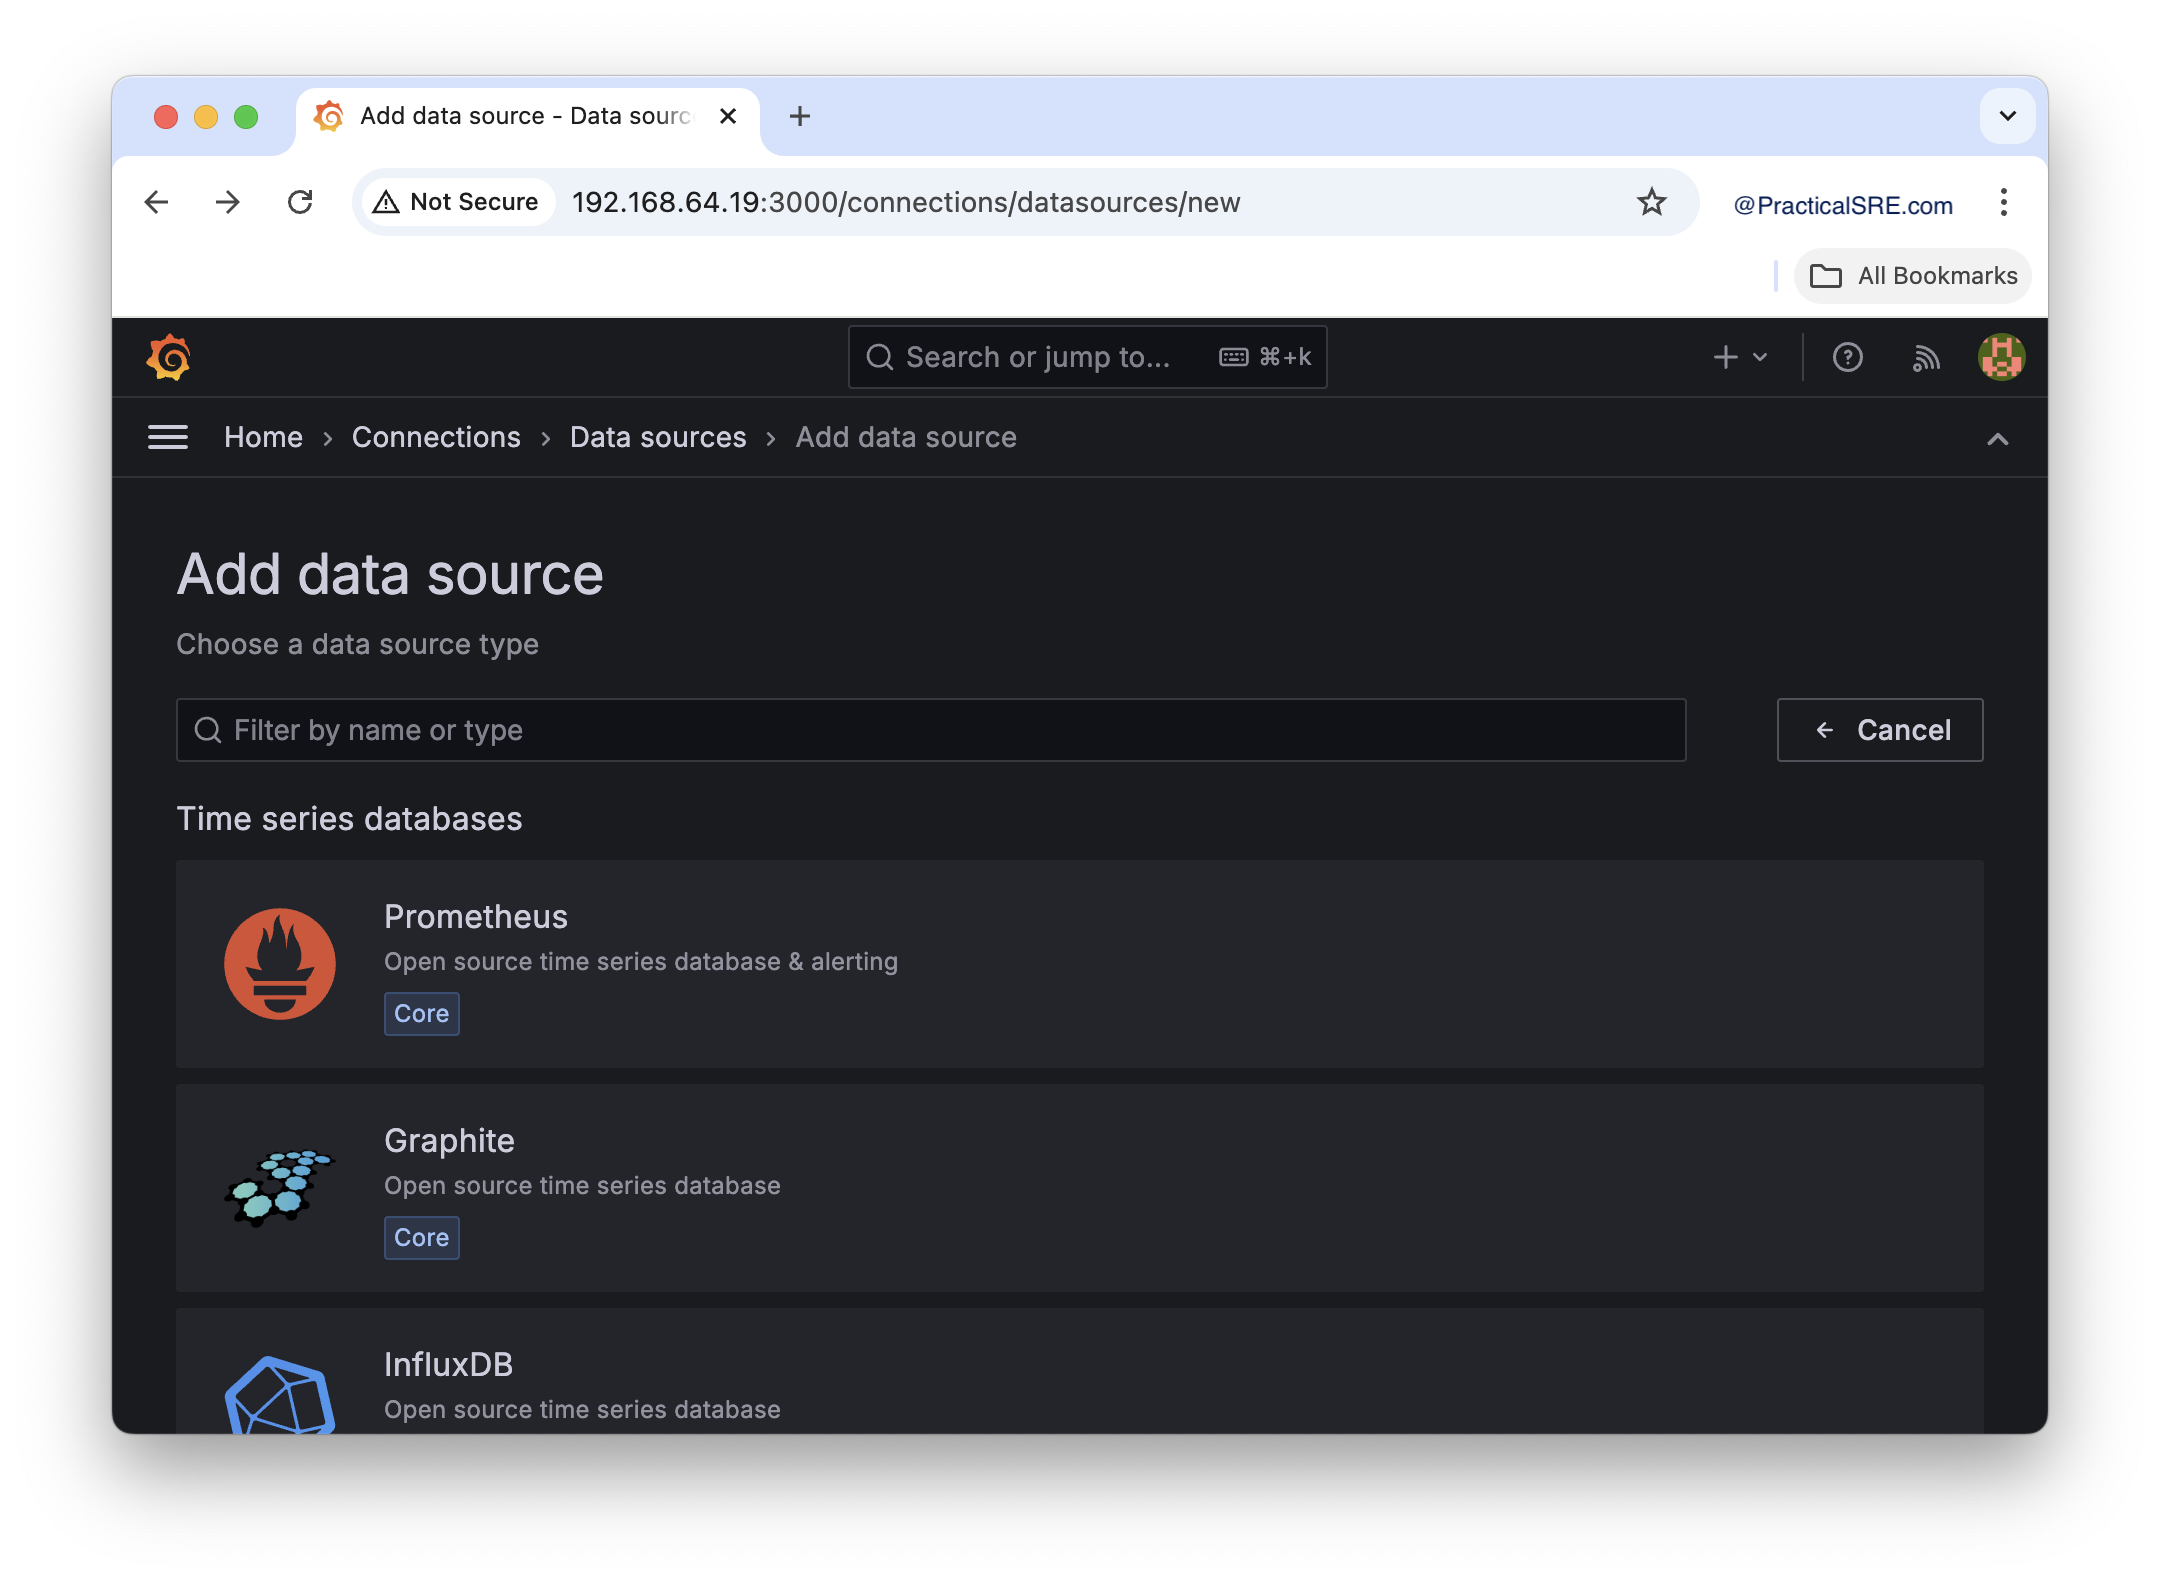
Prometheus is one of the default supported data sources for Grafana, and all we need to do is add the Prometheus Server IP address.
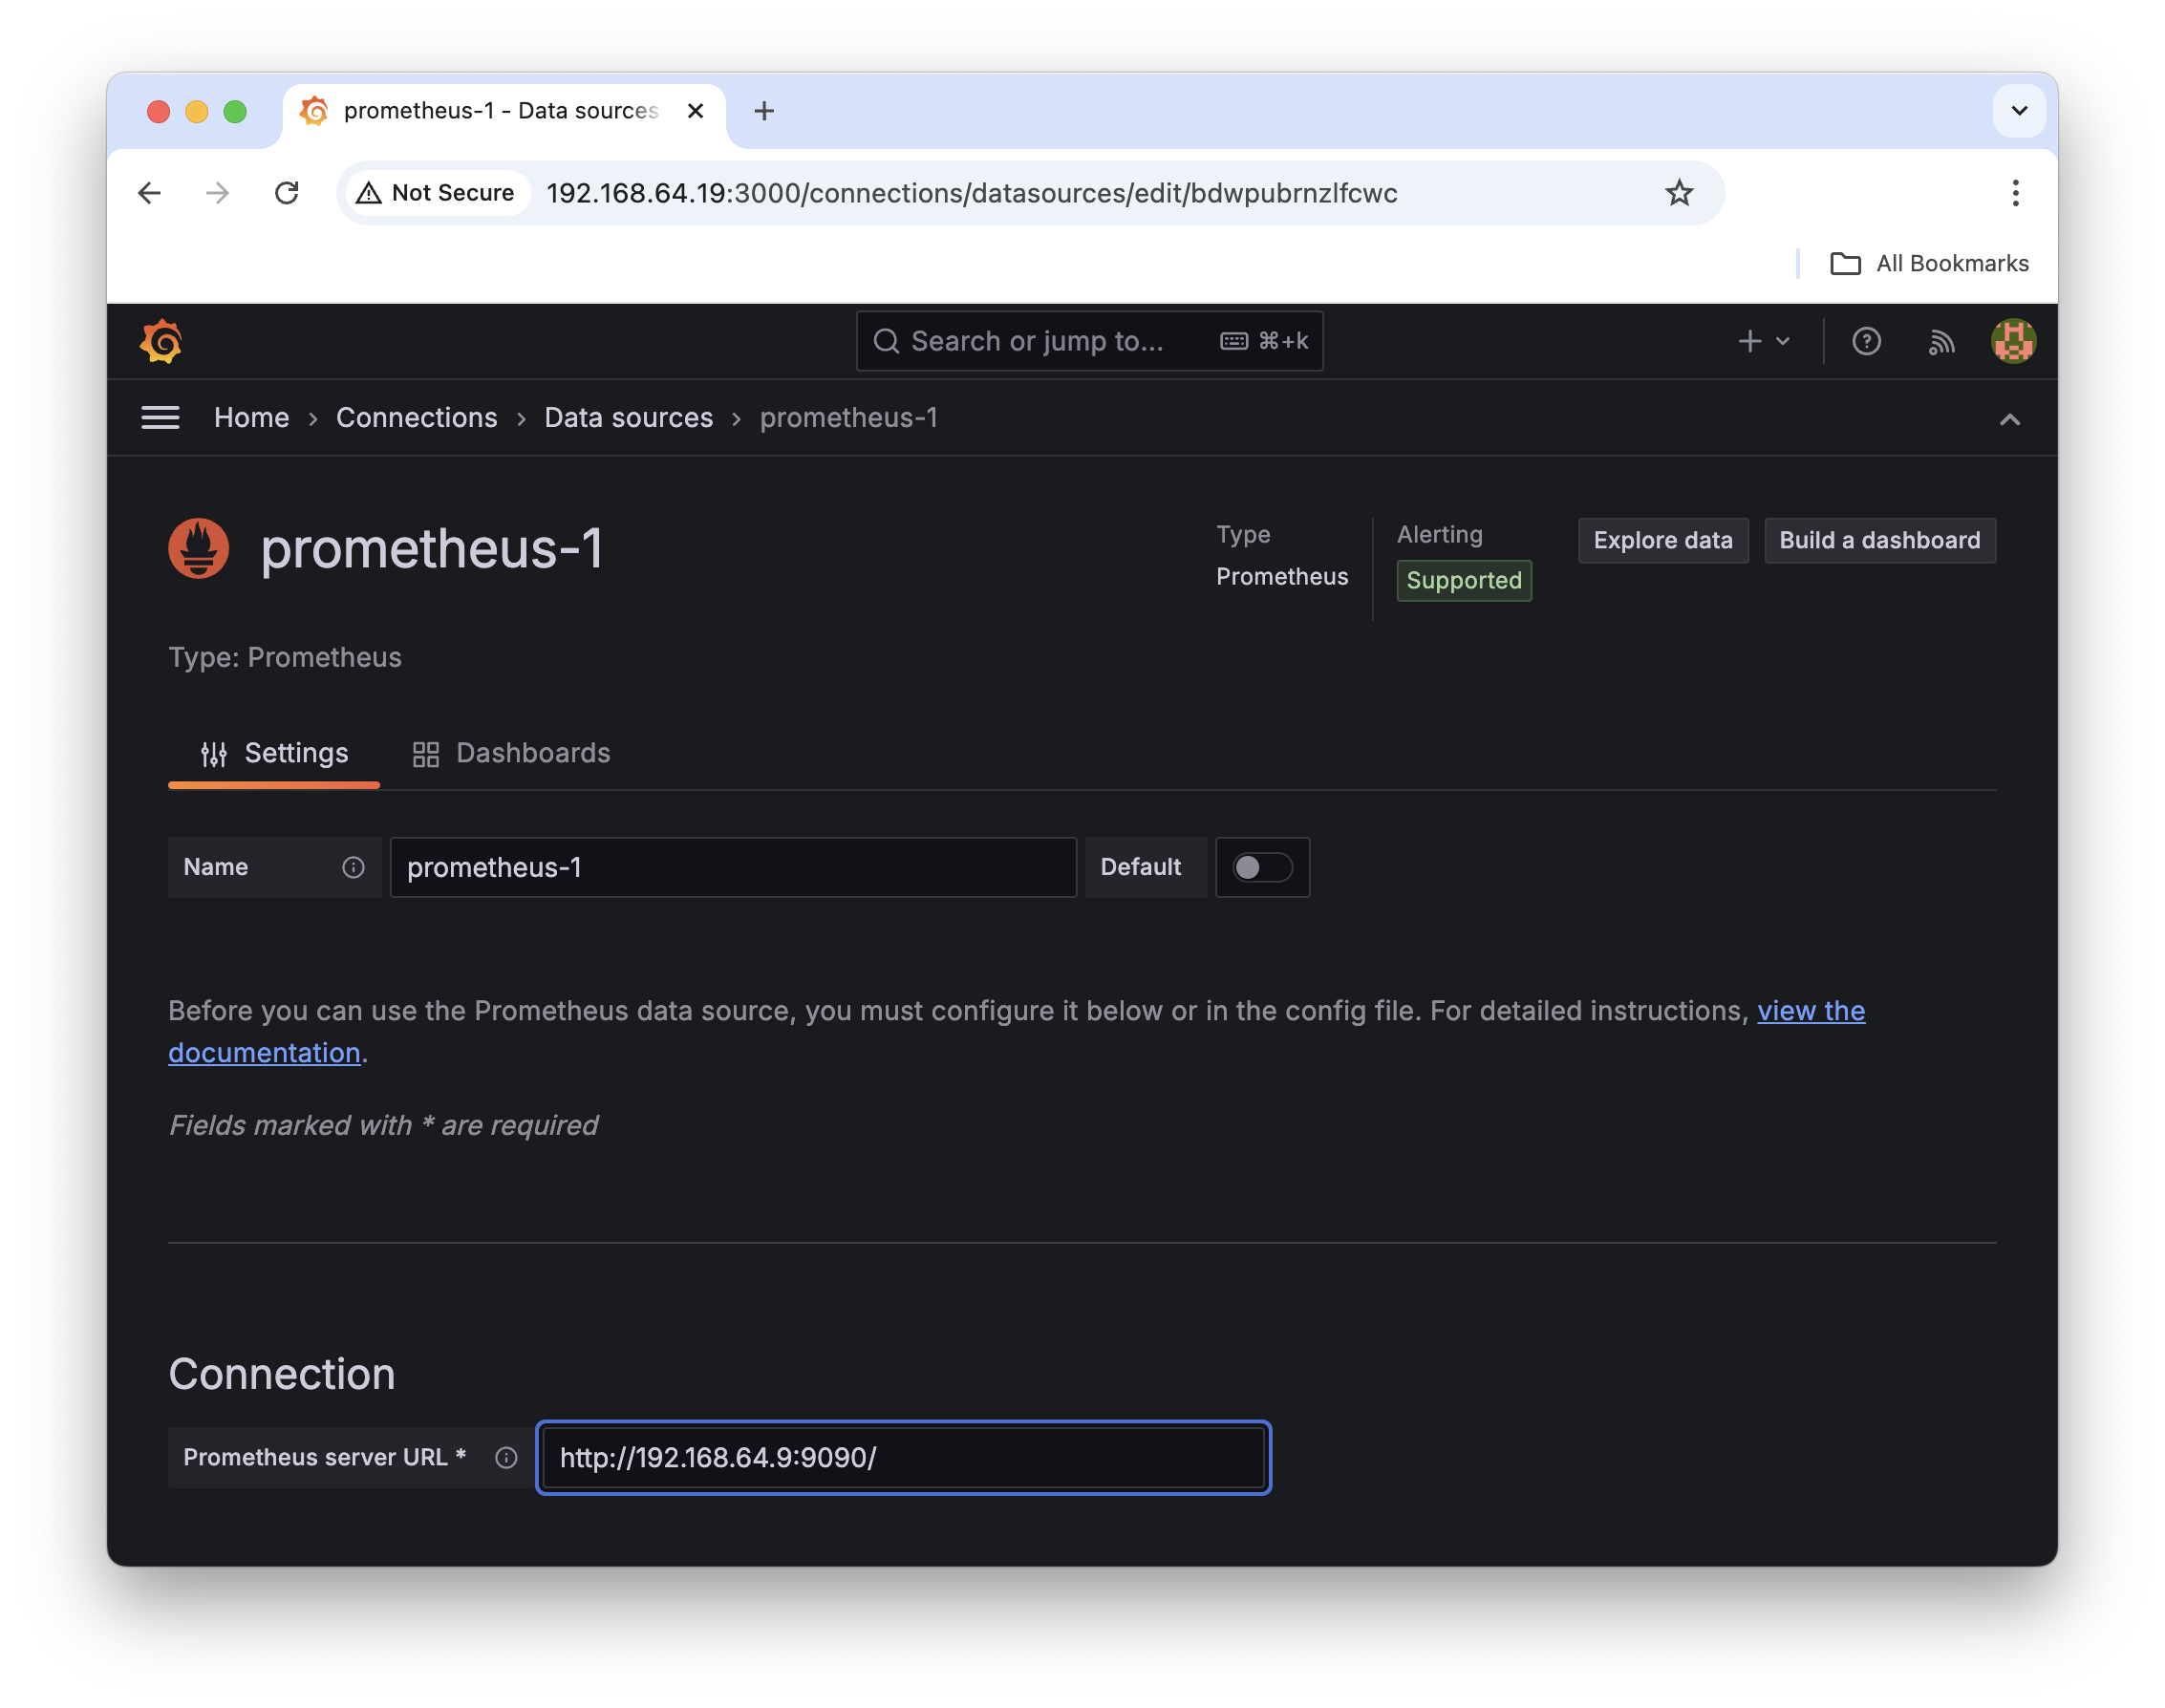
Once the Grafana connection is complete, the available haproxy metrics can be explored from the metrics explorer tab.
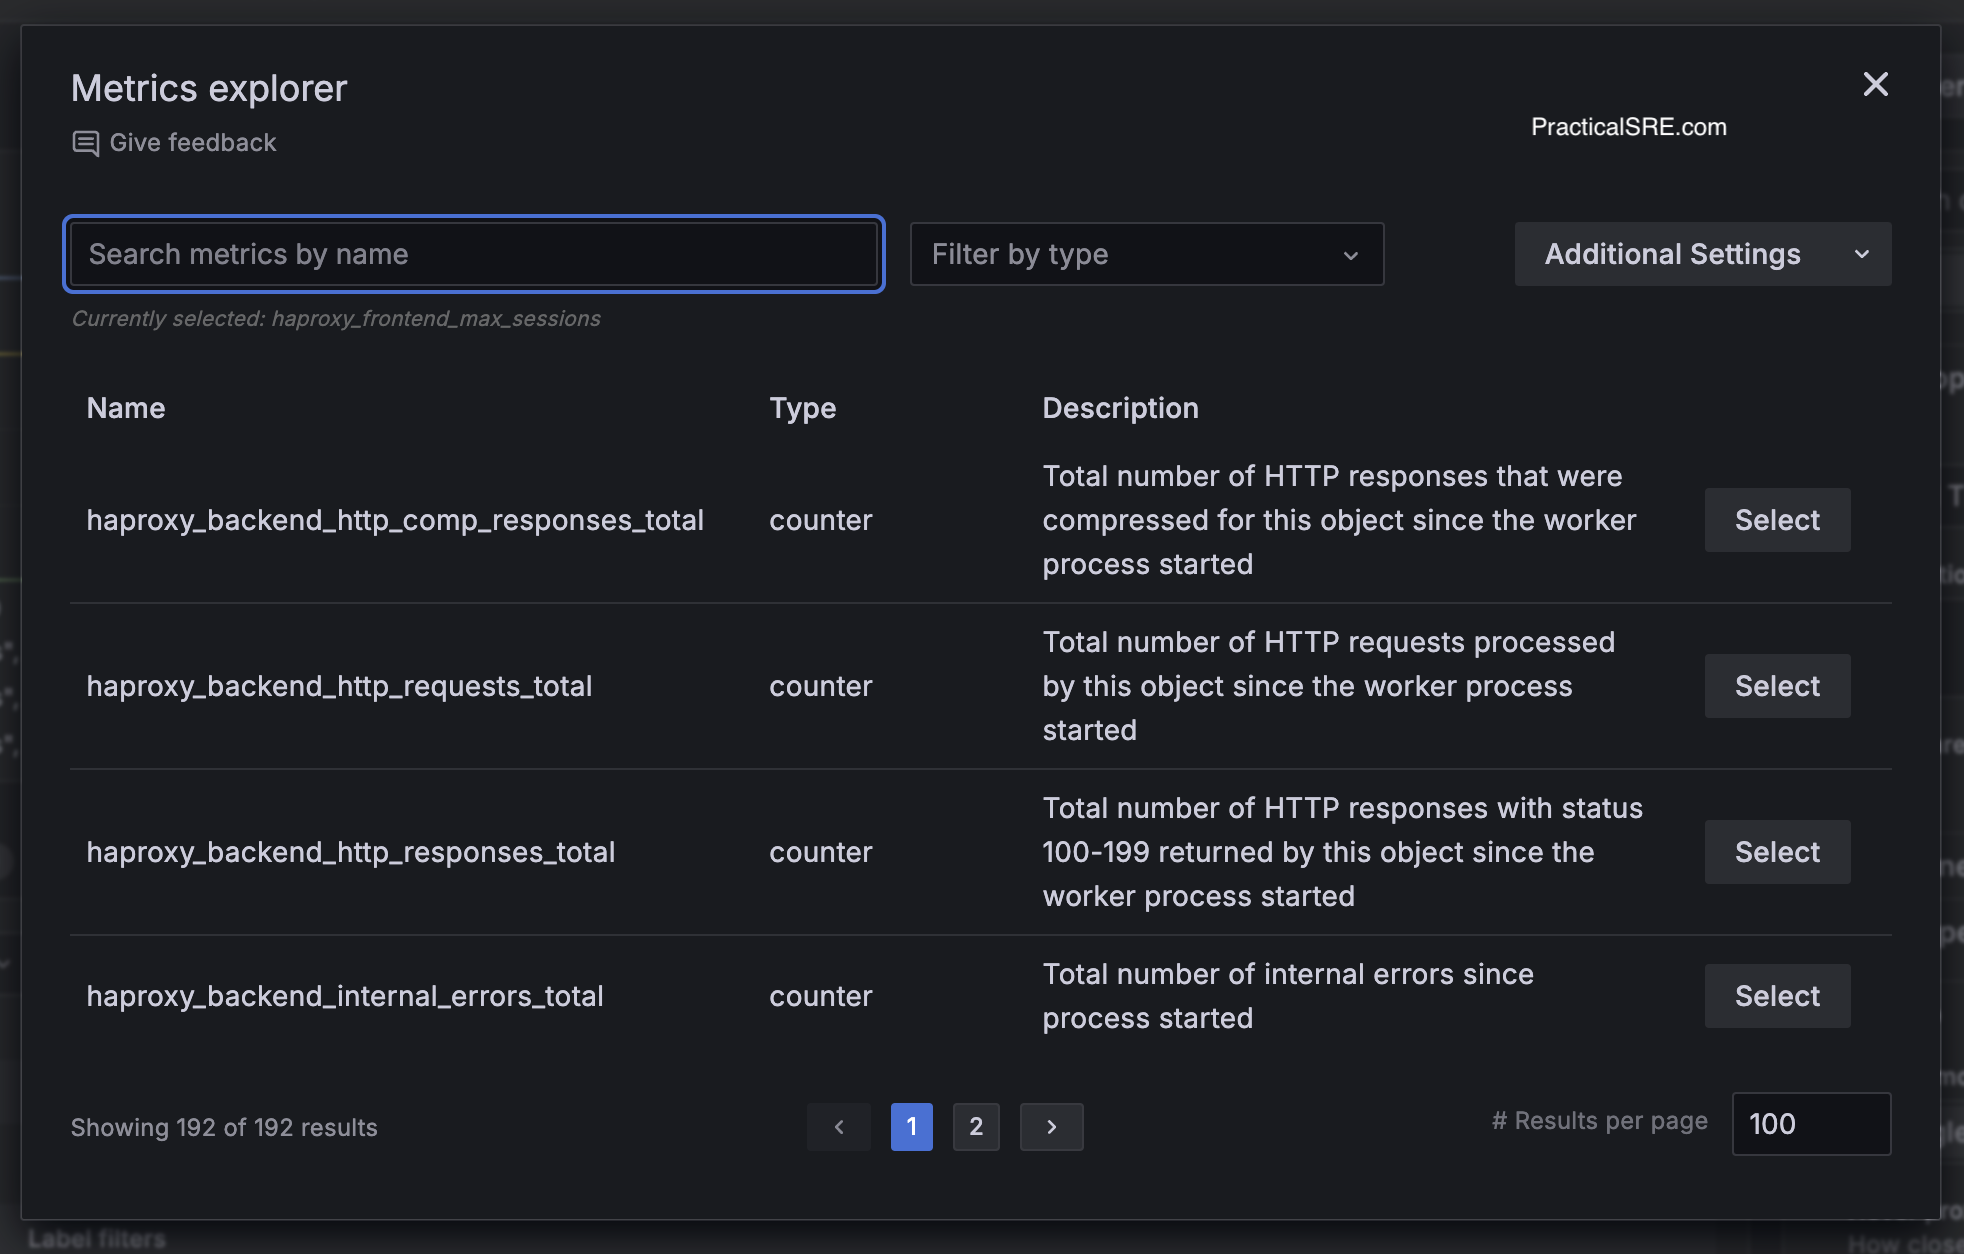
The metrics explorer includes the unique name of the metric, type, either counter or gauge and a helpful description of what the metric is all about. These can be selected and then plotted on the Grafana dashboards.
Sample HTTP load balncer metrics from HAProxy
There are plenty of metrics to choose from, this example shows HTTP metric, specifically, 4xx count over time per backend web server.
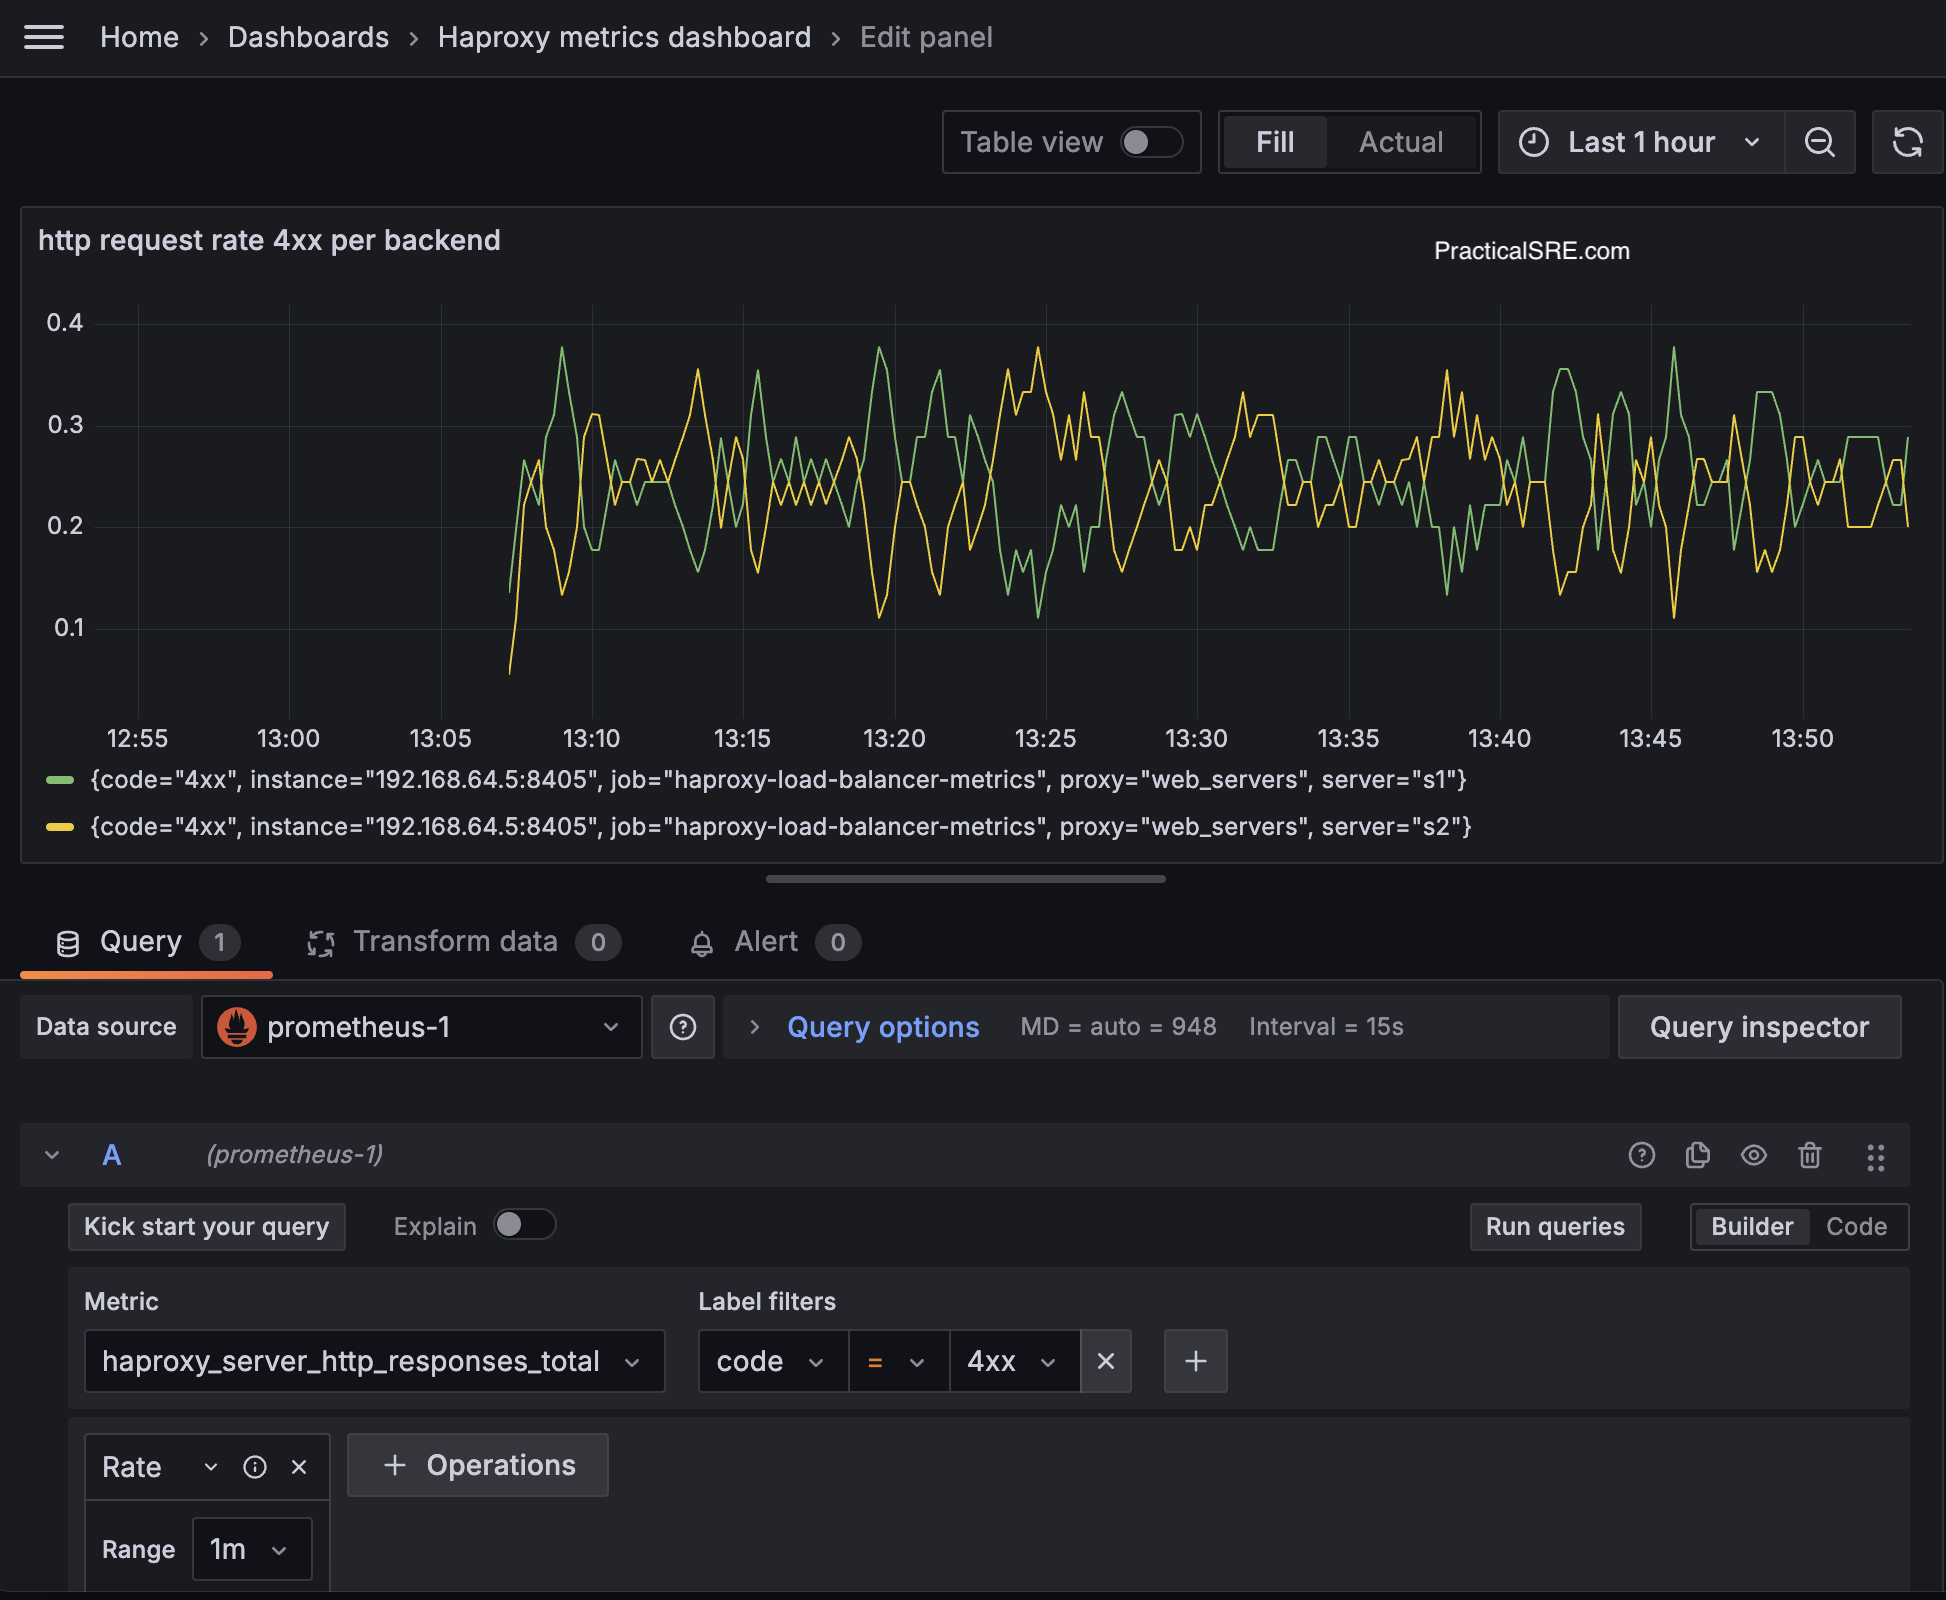
Select the metric name from the drop down, haproxy_server_http_responses_total and add the filters, 4xx in this case. After generating some 4xx metrics by visiting a non-existent endpoint to generate 404s, we can see the metrics start to populate.
We now have a working HTTP load balancer and all the metrics and signals being emitted and viewable via a Grafana dashboard.
