As an SRE or oncall engineer responsible for production applications, you’ll soon find yourself overwhelmed with too many metrics once your observability stack is up and running. It could also be the other way around; you have yet to set up monitoring and are unable to decide what signals to alert on. These 4 golden signals are a good place to start when you want to monitor and alert your production applications and infrastructure. These signals provide a comprehensive view of a system’s behavior and help identify potential issues, sometimes before they escalate.
The Four Golden Signals are a set of key metrics introduced by Google’s Site Reliability Engineering (SRE) team to monitor the health and performance of a system or service. The given link from Google SRE doesn’t go in depth into each of these signals, so this article is an attempt at elaborating these metrics to better understand them.
1. Latency
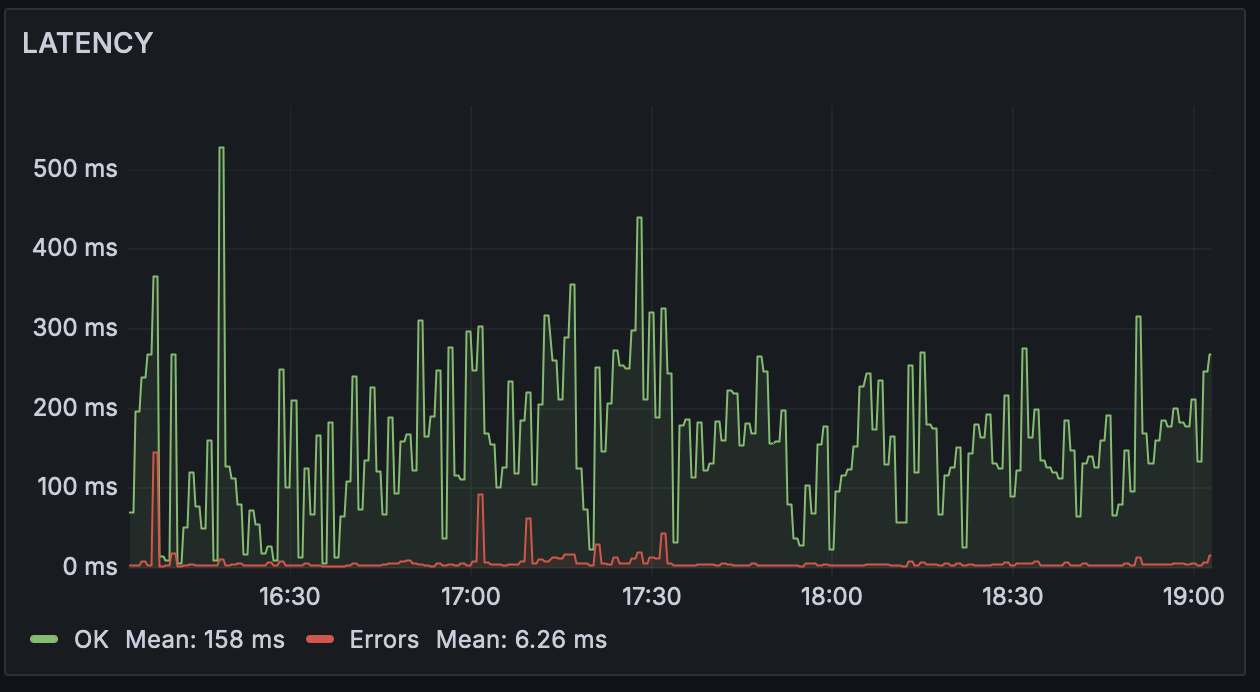
Latency measures the time it takes for a system to respond to a request. It is a critical indicator of the responsiveness and performance of a service. High latency can lead to poor user experience and may indicate bottlenecks or inefficiencies within the system, such as slow database queries, inadequate resource allocation, or poor load balancing.
You can measure the latency from the client to load balancer, the load balancer to the application backends, application downstream latency and so on. Latency can be between two connections, or the latency of the application itself, that is how long the component took to process a request. Each of these metrics will give you a signal on which part of the application stack or architecture is causing you grief. Understand the baseline latencies over time and alert on any deviations above an acceptable threshold.
Understanding percentiles in latency
How different are 90th percentile vs 50th percentile latency?
The 50th percentile latency, also known as the median latency, represents the maximum latency at which 50% of requests are processed. In other words, it’s the midpoint of the latency distribution, where half of the requests have a lower latency, and the other half have a higher latency.
For example, if the 50th percentile latency is 500 milliseconds, it means that 50% of requests were processed in less than 500 milliseconds, while the other 50% took longer than 500 milliseconds.
The 90th percentile latency represents the maximum latency at which 90% of requests are processed. It indicates that 90% of requests have a latency lower than or equal to this value, while the remaining 10% of requests have a higher latency.
For example, if the 90th percentile latency is 1 second, it means that 90% of requests were processed in 1 second or less, while the slowest 10% of requests took longer than 1 second.
As we can see, monitoring both percentiles is important, ideally your monitoring system needs to incorporate both or even include more percentiles.
Here are some common latency numbers, they are usually in the milliseconds (ms).
| Operation | Time taken |
|---|---|
| Read 1 MB sequentially from SSD | 1ms |
| Database insert operation | 1ms |
| Round trip within same datacenter | 0.5ms |
| Read 1 MB sequentially from HDD | 5ms |
| Read 1 MB sequentially from 1Gbps network |
10ms |
| DNS query time* | 15ms |
| TCP packet round trip between* continents |
150ms |
| Time to make a browser API call* | 500ms |
| Time to load a full static webpage* | 1s |
| Time to load a full dynamic webpage* | 3s |
*These depend on internet speed and many other factors, but I added these averages based on my personal experience to get a general idea of latency numbers.
2. Traffic
Traffic refers to the volume of requests or data that a service handles over a given period. It reflects the demand or load placed on the system. Monitoring traffic patterns helps identify usage trends, plan capacity, and detect potential overload situations that could lead to degraded performance or service outages.
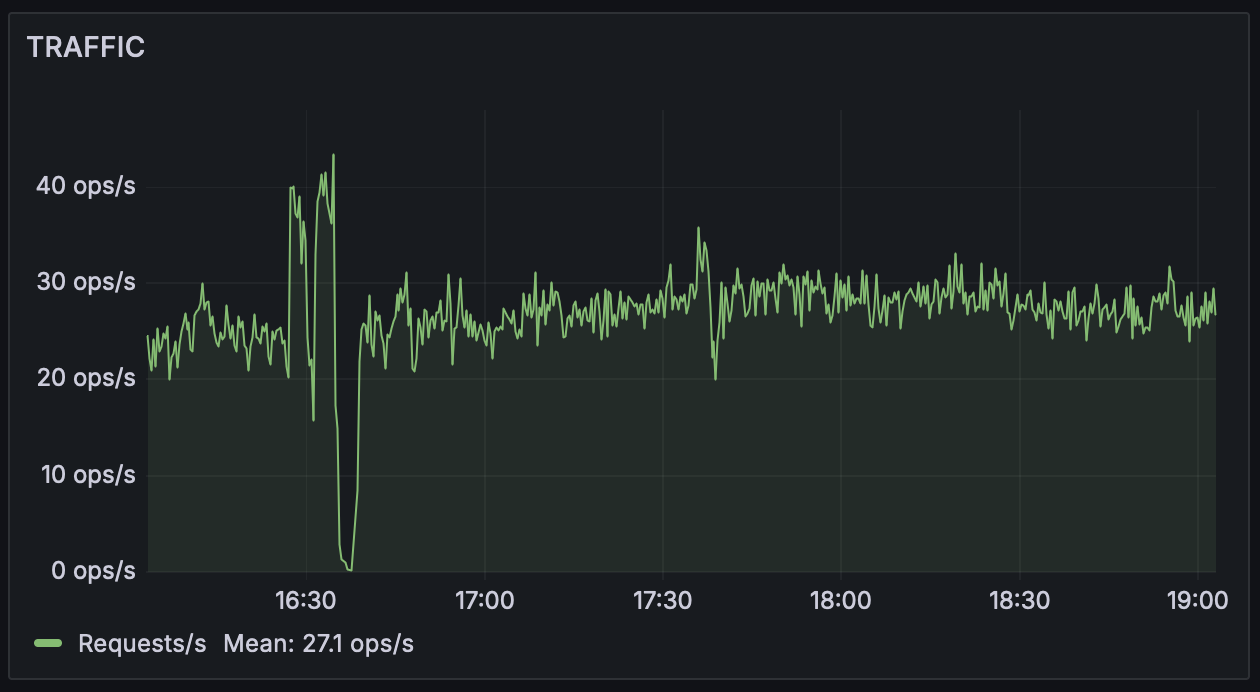
Traffic is usually measured in RPS (requests per second) or QPS (queries per second) ; they both mean the same thing, the count of HTTP requests handled in a second. For databases, it could be transactions per second, and so on. Granularity could also be per hour, per day etc depending on the needs. Traffic patterns vary over a 24 hour period or a 7 day period. Your business website might see a surge in traffic every morning around 9am as employees start using it, your entertainment website might see a surge after work hours or on the weekends. Understanding these traffic patterns will help you plan for scaling up (or down) your infrastructure and forecast future needs of the business. Management often uses these QPS numbers to make business decisions too.
For oncall engineers, a QPS drop is one of the most alarming things you can be alerted for. It could mean that your website stopped receiving traffic due to a failure somewhere in the infrastructure. It is therefore an important signal to keep an eye on.
3. Errors
Errors represent the rate of failed requests or operations within a system. This includes explicit errors (e.g., HTTP 500 errors), implicit errors (e.g., incorrect responses), and policy-based errors (e.g., requests exceeding a defined threshold). Tracking errors is crucial for understanding the health of a system from the user’s perspective and taking prompt action to resolve critical issues.
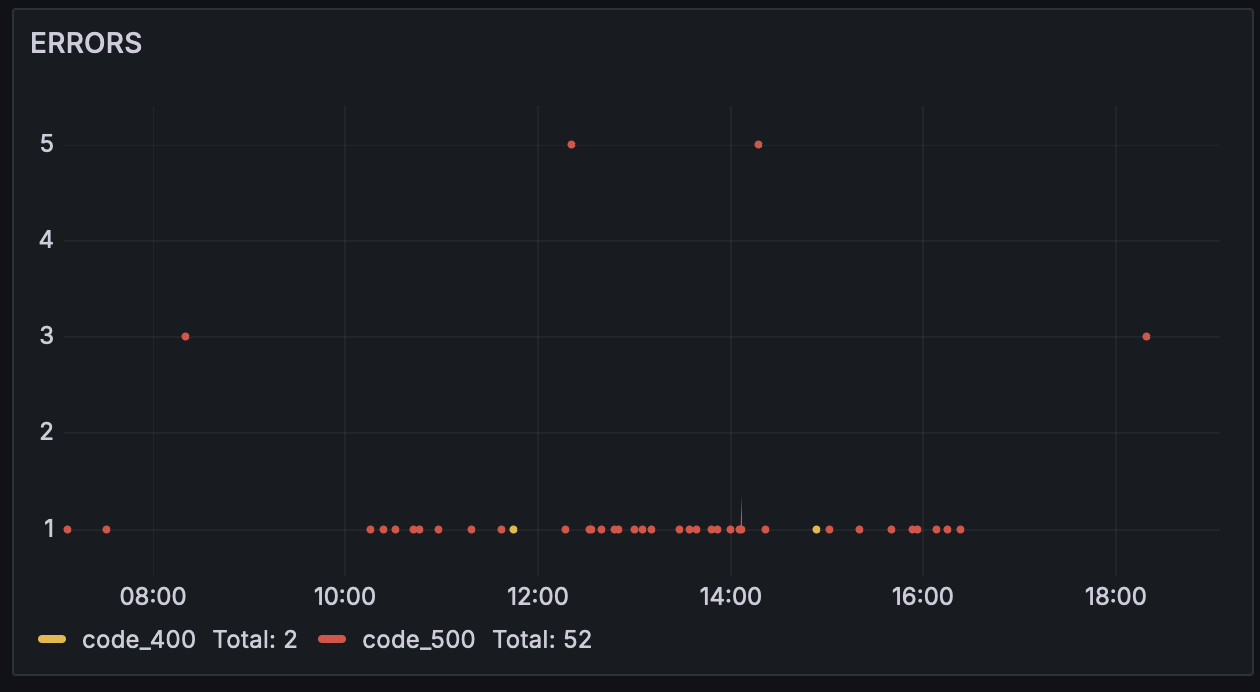
Load balancers and web servers are configured to respond to errors with 5xx responses. 4xx responses either man content was not found or there are permission issues. So if your /login path starts throwing a 503 error, it means that something is broken with the login flow or application. Applications need to log errors too, in java applications, the logs will be filled with caught or Uncaught Exceptions which can be converted into a metric and plotted on a dashboard for swift identification and remediation of errors.
4. Saturation
Saturation measures the degree to which a system or resource is being utilized or overloaded. It indicates how “full” or saturated the system is at a given time. Monitoring saturation helps identify when a system is approaching its capacity limits, allowing for proactive measures to be taken before performance degrades or failures occur.
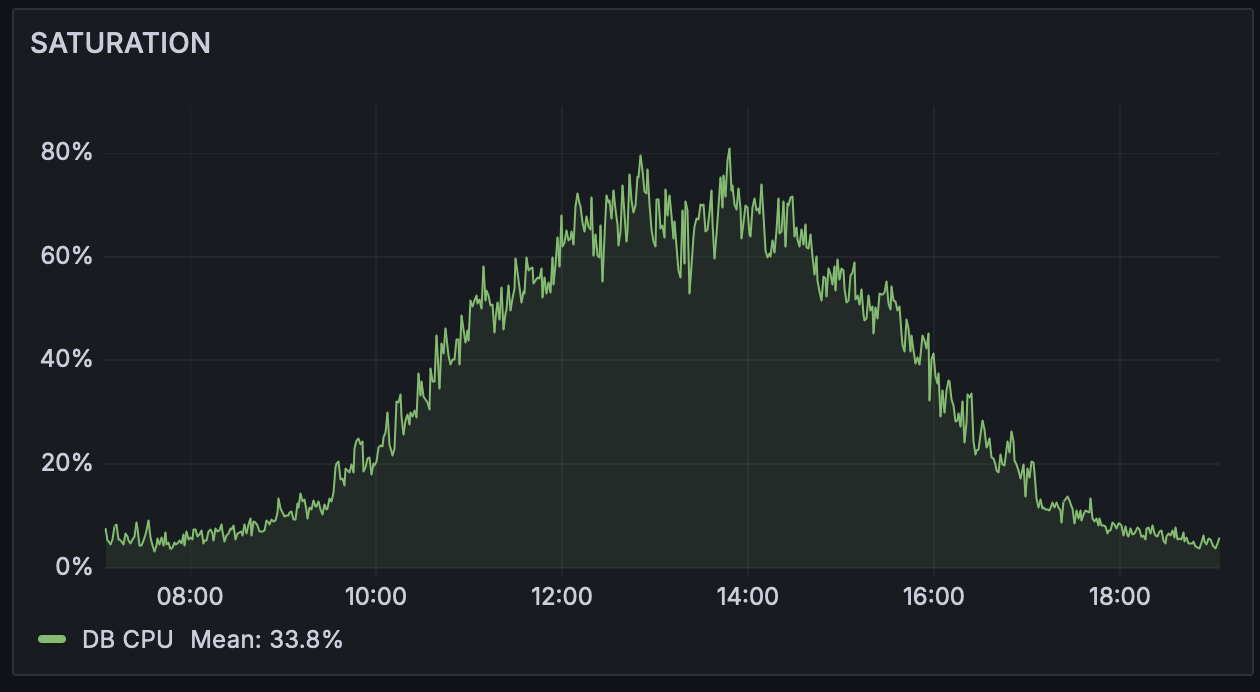
CPU or memory metrics of each server needs to be measured and reported in real time. Database size, disk size or network throughput are also examples of saturation that need to be added to alerting and monitoring. Your network links could be nearing its capacity, and understanding the saturation limit can help you scale and plan for the future.
Conclusion
It goes without saying that each application infrastructure will need its own set of signals to alert on. But these 4 golden signals are a great first indicator and a must have for production facing teams if they want to have a detailed understanding of how their system is behaving, or if they want to troubleshoot production issues without delay.
